Looking Back at the 2000 Dot-Com Bubble: Where Is AI Now?
July 2026 saw AI trading turn risk-averse, sinking chips, memory, and software stocks as the Nasdaq 100 fell 9.5% from its high.
Looking Back at the Four Pre-Bubble Corrections, and Why the Final One Couldn't Be Fixed
In July 2026, the AI trade suddenly shifted from "any news is good news" to "let's first turn over the rock and look at the risks."
Chips, memory, semiconductor equipment, and some AI software stocks retreated in unison. On July 28, the Nasdaq 100 at one point was down about 10% from its closing high on June 2, ultimately settling 9.5% below that peak. Yet, at the same time, most US stocks were still rising, and the S&P 500 remained near its all-time high.
This is not an insignificant detail. It indicates that what occurred was primarily a repricing of crowded sectors, not yet a simultaneous collapse of the entire economy and corporate earnings.
The question thus becomes more specific: Was this decline merely a cooling-off period within a bull market, or the beginning of a 2000-style crash?
The answer from history is not "a large enough drop means the bubble has burst." Before the real internet bubble peaked, the Nasdaq experienced at least four significant corrections of 13%–26%, and each time it recovered and climbed higher.
The first four declines solved problems related to price, localized earnings, or liquidity. The final time, the stock price decline began to, in turn, destroy financing, orders, and corporate earnings. While both appeared as major declines, their nature was entirely different.
I. 2000 Wasn't the First Major Decline, It Was the Fifth Unfixable One
Looking back at the 1996–2000 period, tech stocks experienced five key turning points:
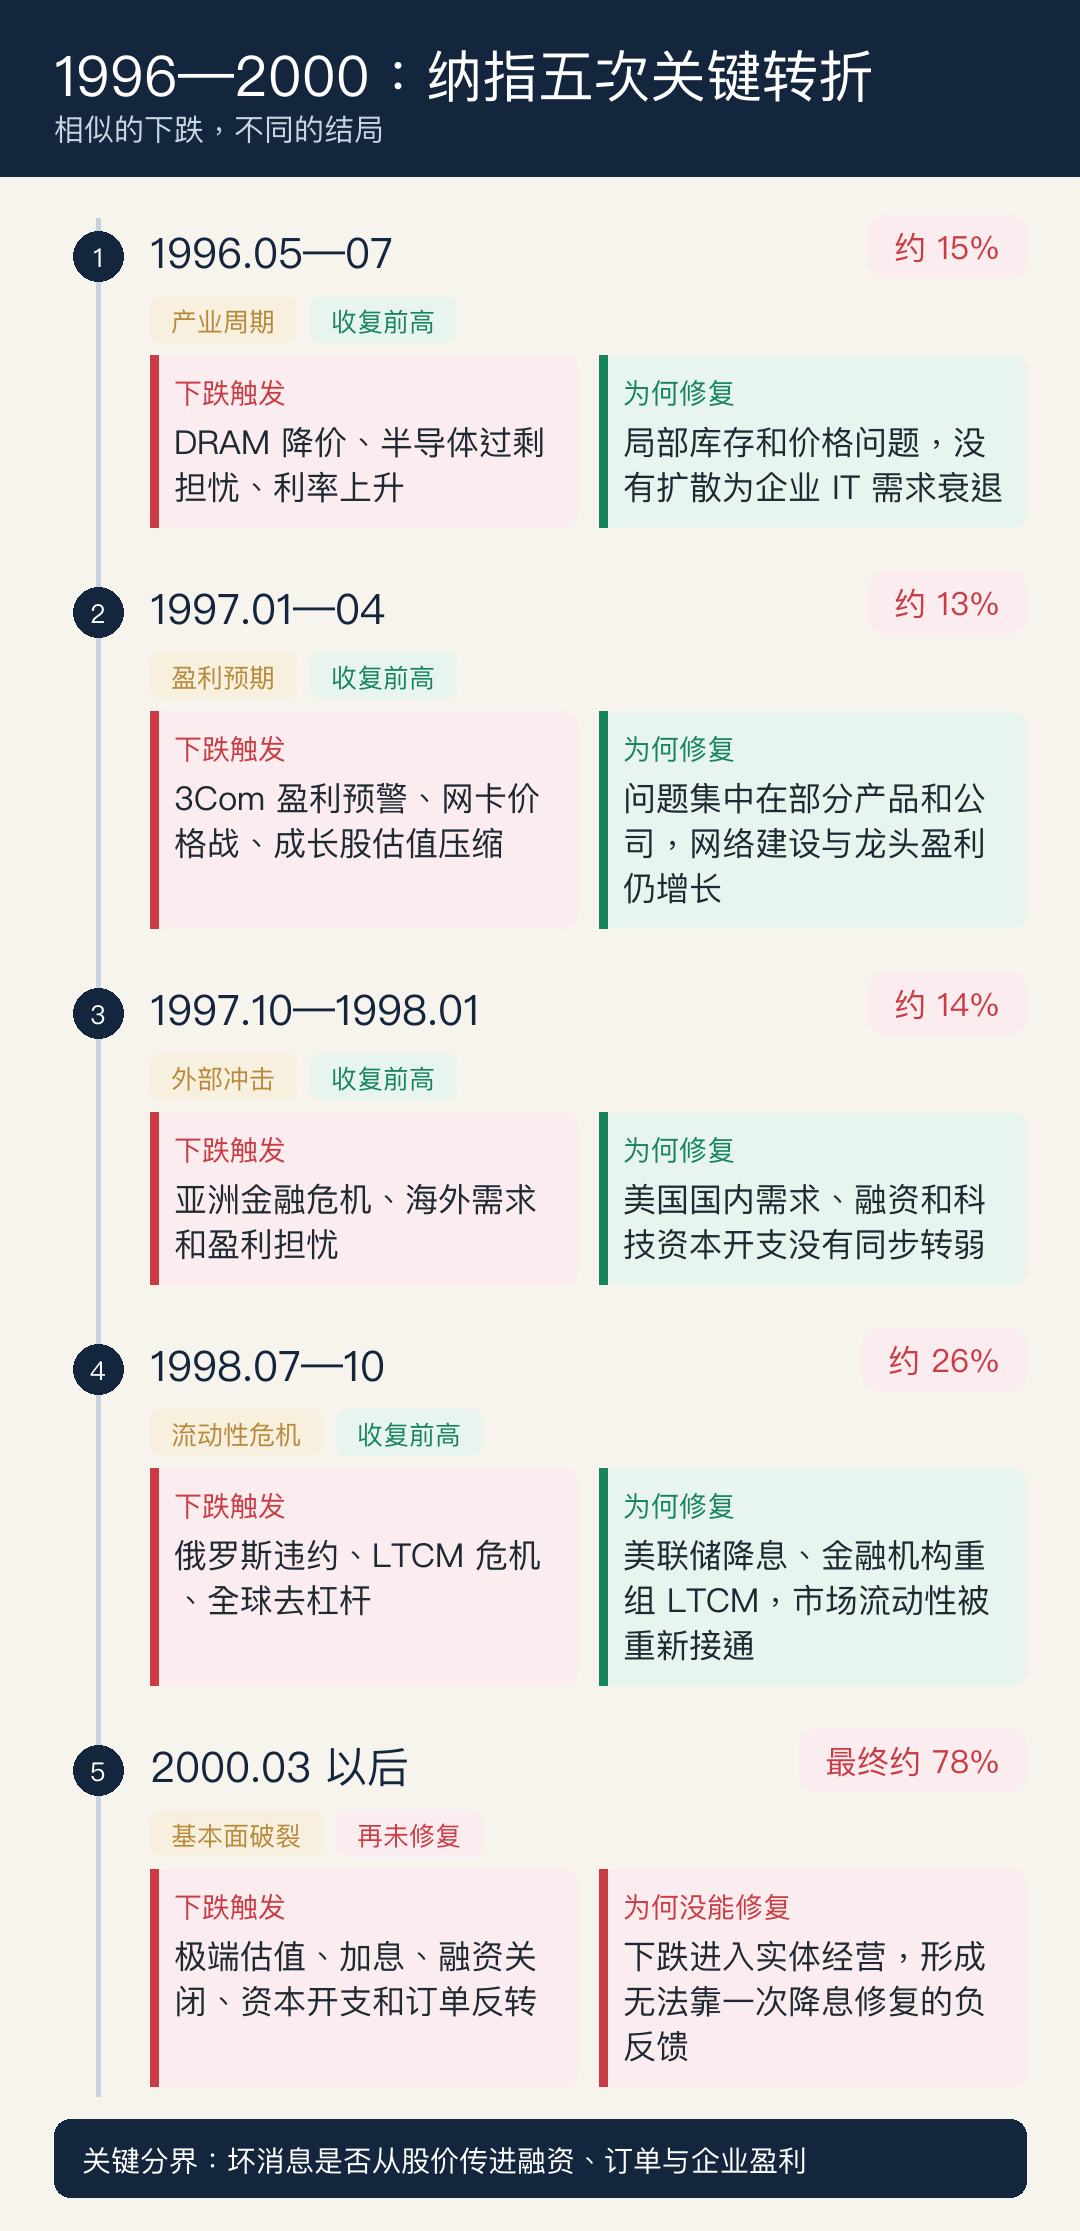
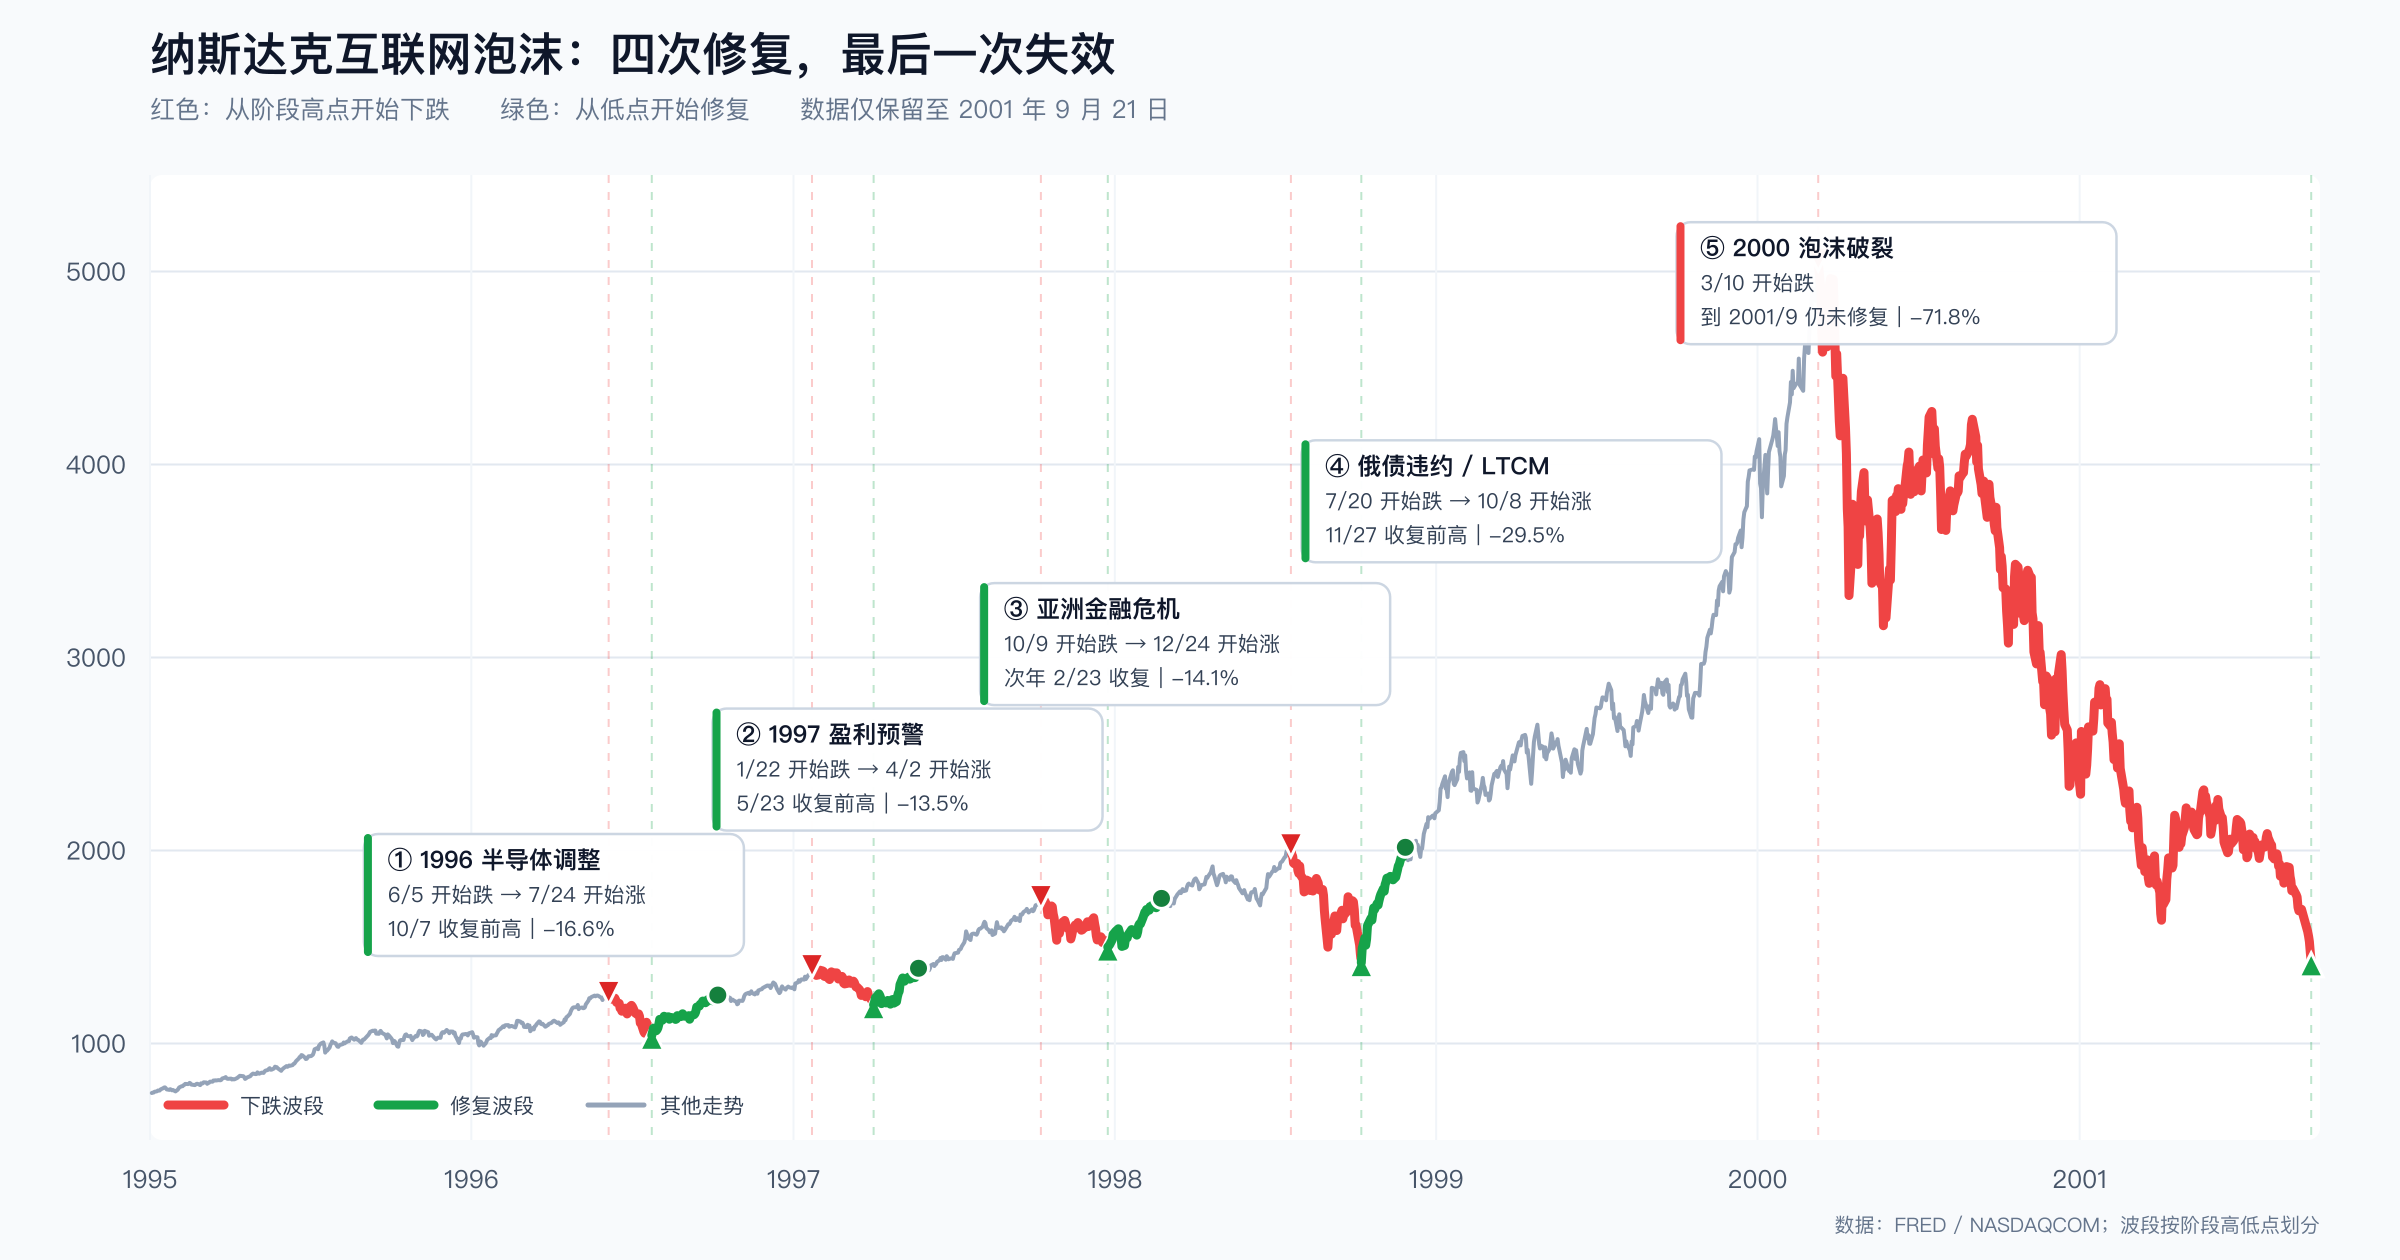
Chart: Red indicates the decline from the phase high to low, green indicates the recovery from the low back to the previous high. Data up to September 21, 2001, excluding the long-term trend post-bubble burst. Data source: FRED / NASDAQCOM.
The difference between these five corrections lies not in how scary the headlines were, but in whether the bad news traveled from the market into the industry, and then from the industry back to hit the market.
The First: 1996, Chips Told a Story of "Overcapacity"
The pressure in 1996 came from the most sensitive part of the tech cycle: price declines for standardized chips like DRAM, inventory concerns, and rising interest rates.
Such signals easily bring to mind today's memory chips and AI accelerators: when supply is tight, sales volume, prices, capacity utilization, and valuations rise together; once the market starts discussing capacity expansion, investors worry that high profits are merely a cyclical peak.
But the problem at the time remained largely confined to specific parts of the supply chain. PC, server, and internet usage were still growing, corporate IT budgets were not frozen across the board, and the financing market remained open.
Therefore, the stock price decline completed the adjustment for valuations and inventory expectations without destroying end-user demand. As long as a new round of orders proved the industry was still growing, capital would flow back in.
The Second: 1997, 3Com Made the Market Question "High Growth Reliability" for the First Time
In early 1997, a profit warning from 3Com and a price war in network adapters triggered a sell-off in tech stocks. On February 10, 3Com fell about 27% in a single day, dragging down the entire networking equipment sector.
This was a classic earnings expectation shock: the market suddenly realized that growth in network traffic didn't guarantee that every type of equipment could maintain its price and profit margins.
Yet, this still didn't turn into a collapse of demand across the entire industry. While 3Com faced product competition and pricing pressure, leaders like Cisco still benefited from enterprise networking and carrier capacity expansion.
The market quickly shifted its judgment criteria from "all networking equipment will rise" to "who has the protocols, ecosystem, customer stickiness, and a stronger product portfolio." The rally didn't end; it just experienced its first divergence.
The Third: 1997 Asian Financial Crisis, Bad News Came from Outside the US
In October 1997, the Asian currency and stock market crisis spread to Hong Kong, raising global concerns that a drop in external demand would drag down US corporate earnings.
A subsequent study by the US Securities and Exchange Commission showed that the US stock market had reacted little to the earlier declines in Southeast Asia; the real panic formed only after the risk spread to Hong Kong and other major markets.
This correction ultimately recovered because domestic employment, consumption, corporate investment, and financing conditions in the US remained solid. The external shock lowered some earnings expectations but did not sever the flow of capital within the internet industry.
In other words, the market worried about "whether overseas markets would drag down the US," not about "US tech companies' customers having no money left to continue buying equipment."
The Fourth: 1998, Russian Default and LTCM Nearly Caused the Financial System to Fail
The 1998 correction most resembled a real crisis. Following Russia's debt default, leveraged trades were forced to unwind, Long-Term Capital Management (LTCM) neared collapse, and credit and liquidity tightened rapidly. The Nasdaq retreated about 26% over roughly three months.
The reason it could still recover was that policy and financial institutions re-established liquidity.
Fourteen banks and brokerages injected $3.6 billion into LTCM; the Federal Reserve cut interest rates consecutively in the fall of 1998. By mid-October, market conditions stopped deteriorating and gradually improved.
Most crucially, after the liquidity crisis was resolved, internet users, traffic, financing, and capital expenditures were still growing. The financial shock had not had time to permanently break the earnings expectations of the tech industry.
The Fifth: 2000, Price Declines Finally Pierced the Fundamentals
On March 10, 2000, the Nasdaq Composite closed at 5048.62 points. Every major decline in the preceding years had proven to be a buying opportunity, and investors naturally expected the same script this time.
However, the market was no longer facing a single problem.
From 1999–2000, the Fed continued to raise interest rates; a large number of internet companies were unprofitable and survived only on equity financing; telecom carriers and network builders expanded with debt; and orders for servers, routers, and optical communications were mixed with advance purchases, duplicate orders, and premature construction.
After stock prices fell, the IPO and secondary offering windows began to tighten. Financing-dependent clients then cut spending on advertising, servers, bandwidth, and data centers. The "real revenue" of suppliers now revealed that the underlying funds did not come from sustainable operating cash flow.
The market decline thus transformed from an outcome into a cause.
Stock prices fall
→ Financing windows close
→ Clients cut capital expenditures
→ Supplier orders and profits are revised down
→ Inventory, idle capacity, and debt pressure rise
→ Stock prices continue to fall
Once this chain closed, a rebound could only alleviate price pressure but could not restore the original earnings assumptions.
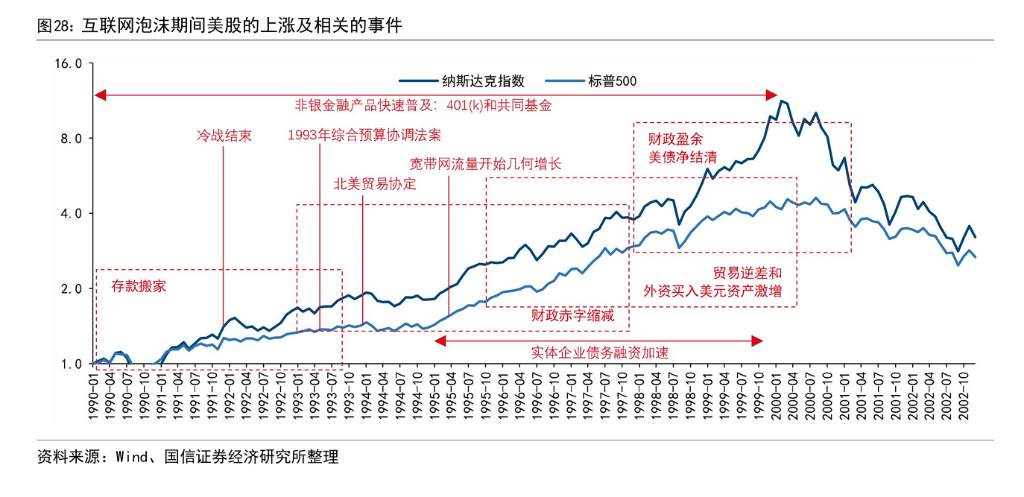
Chart: US stock market trends and macroeconomic events during the internet bubble. Source: Guosen Securities, compiled by Wallstreetcn article.
II. Why the First Four Could Recover, But the Last One Couldn't
Placing the five corrections together reveals that whether the market can recover depends on three levels.
Level 1: Did Valuations Fall?
This is the most superficial level. A 20% drop in high-valuation stocks does not automatically signal the end of an industry trend. It could merely reflect a rise in discount rates, excessively crowded positioning, or the market's reduced willingness to pay the same high price for distant growth.
The first four corrections all involved valuation compression, but earnings expectations were not comprehensively and persistently revised downward. Therefore, once prices became cheaper, growth capital was still willing to return.
Level 2: Are Earnings Supported by Real, Sustainable Demand?
When suppliers deliver equipment to clients and recognize revenue, that revenue is certainly real. But the client's money might come from operating cash flow, or it might come from recently completed financing.
In the late stages of a bubble, these two types of revenue look identical; once financing dries up, their fates diverge completely.
Before 2000, financing for internet companies continuously translated into orders for servers, networking equipment, optical communications, and advertising. The performance of upstream companies was therefore very strong, even appearing more like "good companies with solid fundamentals" than the application companies.
After the real rupture, the market discovered that part of those earnings was a mirror image of the financing boom, not a stable result of end-user demand.
Level 3: Can Supply and Debt Be Reversed?
Software companies can stop hiring, but chip fabs, fiber networks, and data centers cannot easily withdraw capital already invested. The heavier the assets, the longer the construction cycle, and the higher the debt, the more dangerous the downturn becomes.
Back then, the expectation that "traffic doubles every 100 days" drove telecom carriers to lay fiber far exceeding short-term demand. While actual demand continued to grow, it no longer required new equipment on the same scale, leaving vast network capacity as "dark fiber."
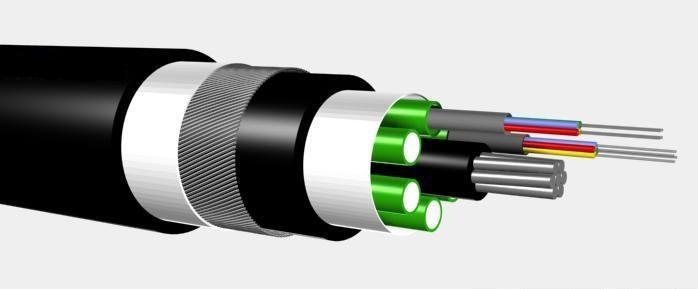
Image: Optical fiber cable.
This is precisely the most counterintuitive aspect of a bubble: the technological direction can be entirely correct, yet the original stocks may never return to their highs.
Internet usage continued to grow after 2000, but some companies were permanently harmed by debt restructuring, technological substitution, price declines, and equity dilution. The future of an industry and the returns for a specific company's original shareholders are not the same question.
III. Which Historical Correction Does This AI Pullback Most Resemble?
History doesn't repeat itself, but it often rhymes. If we are to find a corresponding point, the July 2026 correction does not resemble a single re-run of the 2000 bubble, but rather the overlapping of the following three historical adjustments.
1996: The Market Begins to Worry About Supply and Cycle Peaks
The most severe part of this round of decline has been concentrated in memory, chips, and semiconductor equipment. Some companies had previously experienced parabolic rises, with profits and profit margins also at exceptionally high levels.
At the end of July, SK Hynix's quarterly profit increased approximately sixfold year-over-year, yet its stock price still plummeted. Good performance is no longer sufficient because the market has started asking: Is this sustainable growth, or the last stretch of the best prices and profits before capacity expansion?
This is very similar to the semiconductor adjustment of 1996. The question was not "Is there profit today?" but "Is today's profit the peak of the cycle?"
1997: The Market Shifts from Rewarding Growth to Scrutinizing Growth Quality
After Alphabet announced strong business data, the market became more concerned about the cash flow pressure from AI capital expenditures. In one quarter, its capital expenditures were approximately $44.9 billion, exceeding its operating cash flow of about $39.1 billion, resulting in negative free cash flow.
Microsoft's capital expenditures for the same period rose to about $41 billion, a 70% year-over-year increase. The market's reaction to different companies has already diverged: companies that can demonstrate returns from cloud and AI revenue are still being rewarded, while those only "continuing to increase investment" with no visible returns yet are under pressure.
This is similar to the change after 3Com's profit warning in 1997. The market still believes in networking, and still believes in AI, but has begun to differentiate between those who can turn demand into profit and those merely riding the wave of capital expenditure.
1998: Macro Factors and De-risking Amplified the Decline
Interest rate expectations, long-term U.S. Treasury yields, geopolitical conflicts, and technological competition with China collectively amplified the retreat from crowded trades. Progress in Chinese models and memory production capacity has also led investors to reassess assumptions about U.S. suppliers' pricing power and computing demand.
However, it is not yet like the most dangerous phase of 1998, as there is currently no systemic leverage event similar to LTCM, nor widespread credit market failure.
Therefore, a more accurate assessment is:
The current situation more closely resembles "1996's industry cycle concerns + 1997's profit quality scrutiny + 1998's macro de-risking." There is not yet sufficient evidence to define it as a 2000-style fundamental reversal.
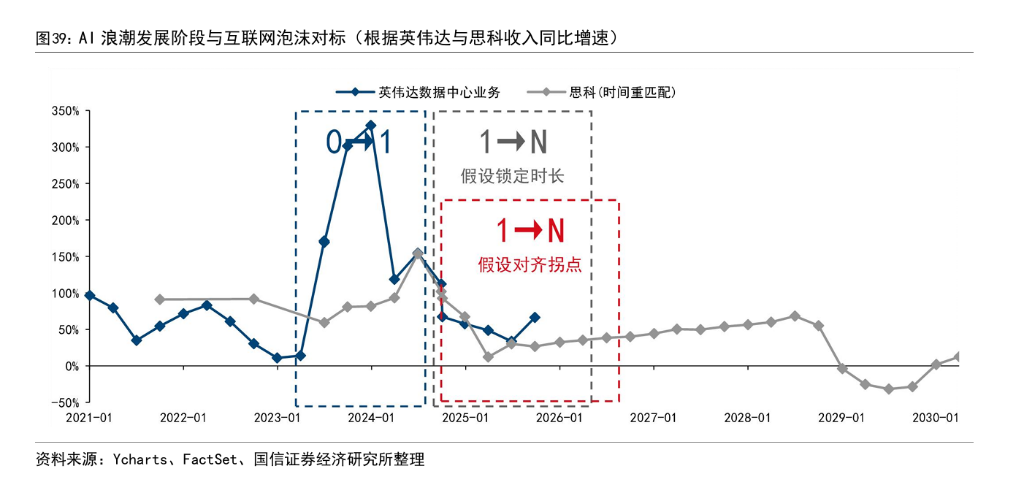
Chart: Phase comparison using Nvidia's Data Center business and Cisco's revenue growth rate. Source: Guosen Securities, compiled via Wallstreetcn article. This chart is an analogical framework, not a deterministic forecast.
IV. Are Valuations Expensive? It's Not About the Numbers, It's About Whether Profits Materialize
There is undoubtedly a bubble in today's AI sector, but its distribution is uneven.
A historical comparison estimate from late 2025 suggested that since October 2022, the S&P 500's stock price had led fundamentals by about 26.6%; at the end of the "1→N" phase of the internet bubble, this figure was about 69.1%, and at the final peak, about 84.3%.
This metric cannot prove the market will definitely rise further, nor can it pinpoint the exact top. It only indicates that, in terms of the deviation of stock prices from fundamentals, the overall market at that time had not yet reached the extreme levels of 2000.
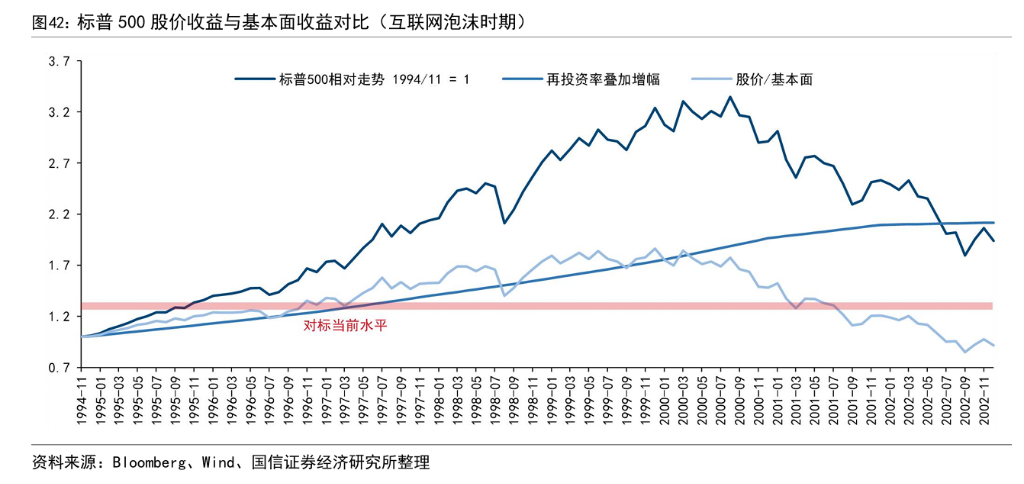
Chart: Comparison of S&P 500 stock price, reinvestment rate, and fundamental earnings during the internet bubble. The red line indicates the current relative level calculated in the report. Source: Guosen Securities, compiled via Wallstreetcn article.
A more important difference is the source of funding.
In 2000, many internet and telecom customers relied on equity and debt financing to purchase equipment. Today, the primary AI capital expenditures come from companies like Microsoft, Alphabet, Amazon, and Meta, which possess massive operating cash flows. They can afford longer investment payback periods, and a closed financing window won't immediately zero out their spending.
This makes today's systemic fragility lower than in 2000, but it doesn't mean every link in the chain is safe.
The companies most likely to experience permanent valuation declines are probably of three types:
- Cyclical suppliers whose profits are highly dependent on shortages, price hikes, and customer pre-purchasing;
- Data center and compute leasing providers with heavy capital investment, opaque utilization rates, and a need for continuous financing;
- Application companies lacking customer stickiness and differentiation but receiving high valuations based on an "AI label."
The upward trend of AI and some stocks not returning to their highs can both be true. The internet bubble has already proven: industry demand growth does not equal revenue growth for existing companies; company revenue growth does not equal returns for existing shareholders.
V. When Should We Admit: This Time, It Really Can't Go On
Judging whether a bubble has truly burst doesn't require guessing if a certain day is the market top. It requires observing whether the positive feedback loop is reversing.
Signal 1: Major Customers Consecutively Cut Capital Expenditures
A single company slowing spending is not enough. The real danger is when multiple cloud providers lower their data center, GPU, and power investment for two or more consecutive quarters, while attributing the reason to AI revenue or utilization falling short of expectations.
Signal 2: Usage Grows, But Price and Utilization Simultaneously Decline
Growth in technology usage does not guarantee supplier profitability. If cloud GPU rental prices fall, cluster utilization drops, and inference unit price declines faster than call volume growth, capital returns will deteriorate.
Signal 3: Orders, Inventory, and Accounts Receivable All Deteriorate Together
Pre-purchasing and duplicate orders amplify demand on the way up and create an order vacuum on the way down. If chip, server, and network equipment companies simultaneously experience order cancellations, inventory build-up, and slower collections, it indicates the problem has moved from valuation to earnings.
Signal 4: Financing-Dependent Customers Begin Defaulting or Halting Expansion
If compute leasing providers, data center developers, or AI startups rely on debt and equity financing to sustain purchases, widening credit spreads and a closed financing window will transmit along the industry chain. That would more closely resemble the key mechanism of 2000.
Signal 5: Stock Price Declines Begin to Suppress Real Demand in Turn
When layoffs, capital expenditure cuts, supplier profit warnings, and asset impairments reinforce each other, the market is no longer just anticipating fundamentals but actively creating worse fundamentals.
Only when these signals spread from individual companies to resonate across the industry chain should a correction be upgraded to a "trend reversal."
The judgment criteria can be condensed into one sentence:
An ordinary correction is price waiting for profits to catch up; a true reversal is price falling so fast that profits can never catch up.
VI. Conclusion: The AI Trend is Undoubtedly Correct; Errors May Lie in Price, Timing, and Company/Sector Selection
This AI stock correction is not noise to be ignored. It has exposed real issues like valuation crowding, capital expenditure returns, semiconductor cycles, and supply expansion.
However, as of the end of July 2026, it more closely resembles the repairable adjustments seen several times before 2000, rather than a confirmed fundamental collapse.
The main current contradiction is that the market has begun demanding companies prove their input-output efficiency, not that AI demand has disappeared. Cloud revenue, model calls, and infrastructure investment are still growing, and the main buyers still possess strong cash flows.
This means the overall AI trend remains positive, while bubbles exist in some segments; some companies will recover as profits materialize, while others, even if they survive, may not see their valuations return to previous highs.
What truly warrants vigilance is not another 10% drop in chip stocks, nor a single earnings report failing to meet extremely high expectations.
What warrants vigilance is: customers starting to cut capital expenditures, supplier orders and inventory simultaneously reversing, financing-dependent companies losing funding, and stock price declines further damaging real demand.
Until then, this looks more like a shift from "All AI is worth buying" to "Only AI companies that can prove cash flow and moats are worth buying."
And this is precisely the necessary stage for every technological revolution to move from story to industry.
Risk Disclosure: This article is for historical research and industry comparison and does not constitute any investment advice. Historical analogies can only help identify mechanisms and cannot be used for precise predictions of market tops, bottoms, or individual stock prices.
References
- FRED: Nasdaq Composite Index (NASDAQCOM) — St. Louis Fed database, data source for the 1996–2000 five-adjustment chart in the text.
- SEC: Post-Study on the Impact of the 1997 Asian Financial Crisis on U.S. Markets — Official U.S. Securities and Exchange Commission report, source cited in the "Third Adjustment" section.
- Federal Reserve History: The LTCM Near-Failure — Official Federal Reserve historical archives, authoritative record of the 1998 Russian default and LTCM bailout.
- Wallstreetcn: Guosen Securities Internet Bubble vs. AI Comparative Study — Source for the compilation of multiple comparative charts in Parts II, III, and IV of the text.
- Axios: July 2026 Chip Stock Correction Report — News source for the background of this AI correction and factors related to U.S.-China tech competition in the text.
Scan with WeChat to share
Screenshot or long-press the QR code to forward it
📌 Related Posts
DeepSeek Becomes the Kill Line for LLMs
Will DeepSeek's rock-bottom model pricing eliminate OpenAI and Anthropic? The answer is more complex than that.
Leopold Aschenbrenner: AI, Electricity, and the Trillion-Dollar Cluster
Situational Awareness Fund sells most of its public equity portfolio to Citadel, surrendering a successful AI trade amid market reversal.
Why Storage Is Always in Short Supply: The Narrative and Investment Logic of AI Storage
Over two years, AI infrastructure focus shifted from GPUs to power, then optical modules, liquid cooling, transformers, and data center REITs.
Subscribe to Updates
Leave your email to get the latest articles and project updates — or subscribe with your favorite RSS reader
Add 0to1.site/en/rss.xml to RSS readers like Feedly or Inoreader
Comments (no account needed, anonymous welcome)
No comments yet — be the first!